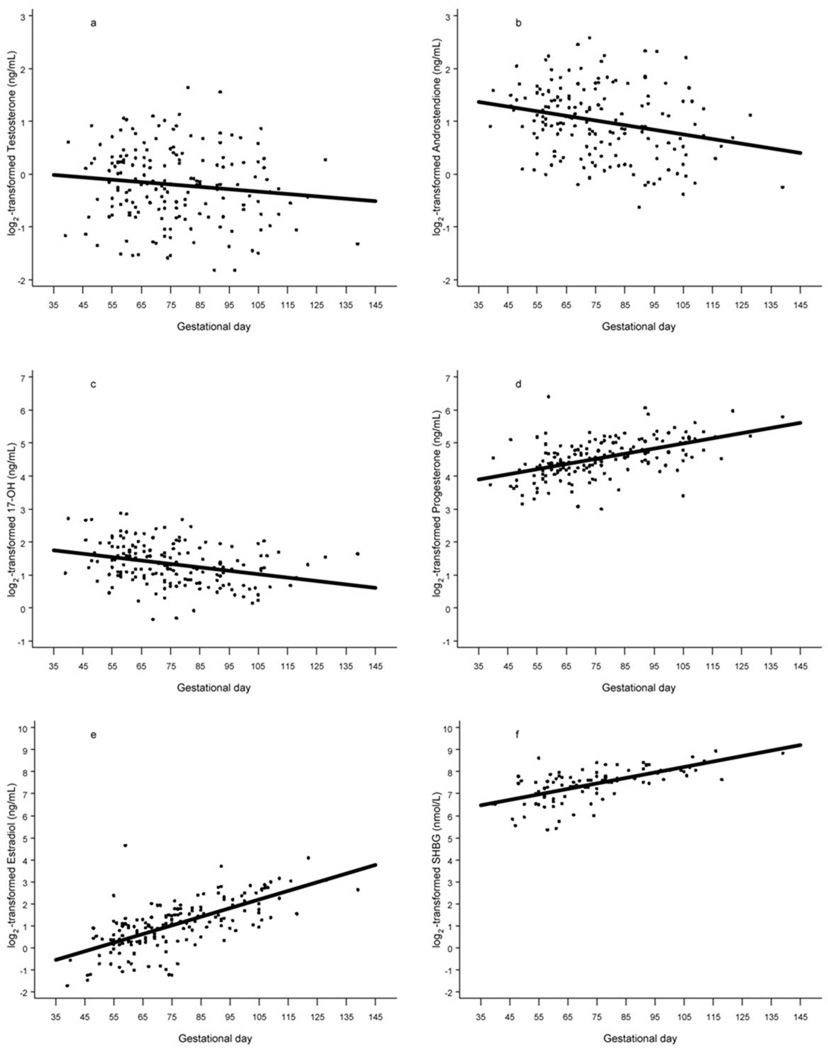
Figure 1.
Scatterplot of log2-scale testosterone (a), androstenedione (b), 17-OH-progesterone(c), progesterone (d), estradiol (e), and sex hormone binding globulin (f) concentrations (controls combined) by gestational age. The solid line shows the progression of hormone concentrations during pregnancy, estimated by linear regression.

