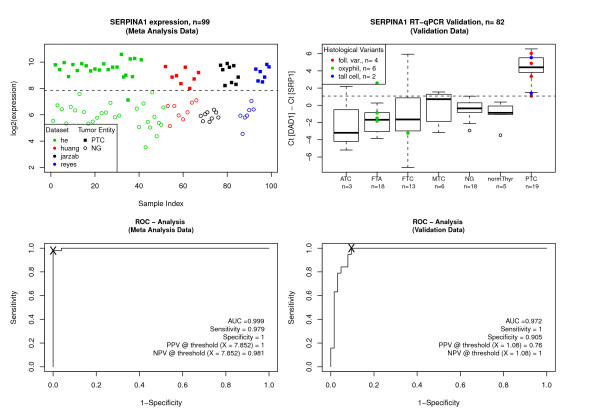
Figure 3.
SERPINA1 expression. Expression values and receiver-operating-characteristics (ROC) analysis of the SERPINA1 gene in the meta analysis data (left) and the RT-qPCR independent validation data (right). Classification thresholds were chosen from ROC analysis (shown as 'X' in the ROC plots). Positive Predictive Values (PPV) were calculated as number of true positives/number of all positives, Negative Predictive Values (NPV) as number of true negatives/number of all negatives, both at the chosen threshold.

