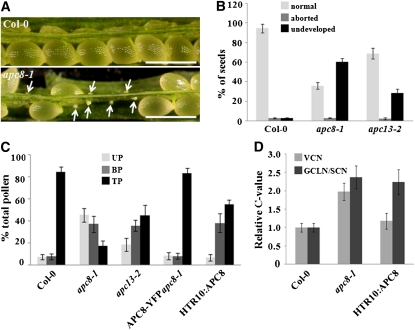
Figure 4.
Seed Set Analysis and Pollen Development of apc8-1.
(A) Dissected mature siliques of wild-type (Col-0, top) and apc8-1 plants (bottom). Undeveloped ovules are indicated with arrows. The undeveloped ovules are tiny and white, whereas developing seeds are large and green. Bar = 500 μm.
(B) Percentage of normal seeds (light gray), aborted seeds (dark gray), and undeveloped ovules (black) from self-pollinated Col-0, apc8-1, and apc13-2 plants. Error bars represent sd from the mean of 10 siliques from each of 20 individual plants.
(C) Distribution of uninucleate microspores (UP; light gray), bicellular pollen (BP; dark gray), and tricellular pollen (TP; black) in mature anthers. Pollen was stained with DAPI, and the percentage of each stage was determined for Col-0, apc8-1, APC8-YFP apc8-1, and HTR10:APC8 (line 8-2). All measurements represent the average of three biological replicates with error bars representing the se. For each independent replicate for each genotype, 600 to 800 pollen grains from 5 to 10 plants were analyzed.
(D) DNA content of vegetative cell nuclei (VCN; light gray), generative cell-like nuclei/sperm cell nuclei (GCLN/SCN; dark gray) in pollen from different genotypes. The relative C values of apc8-1 (n = 108) and HTR10:APC8 (n = 126 from line 8-2) were calculated from DAPI fluorescence values normalized to the mean fluorescence of wild-type cells (n = 98 for vegetative cell nuclei; n = 112 for sperm cell nuclei). n indicates the number of pollen grains that was measured. All measurements represent the average of three biological replicates, with error bars representing the se.
[See online article for color version of this figure.]

