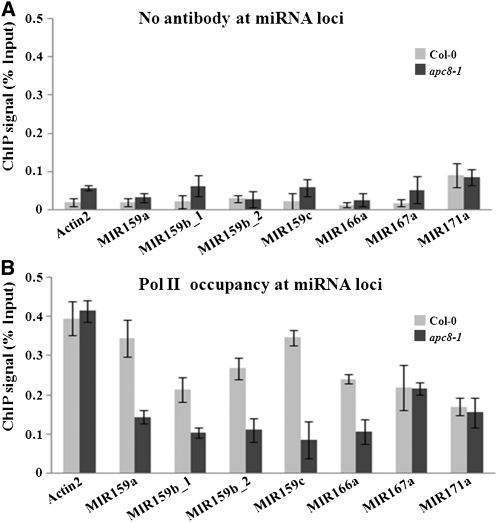
Figure 6.
Pol II Occupancy at miRNA Loci.
(A) ChIP performed with Col-0 (light gray bars) or apc8 (dark gray bars) with no antibody as the negative control.
(B) ChIP performed with anti-RPB1 antibody. The results were reproducible in two biological replicates. The mean and sd were determined from one representative biological replicate.
Error bars in (A) and (B) show sd calculated from three technical replicates.

