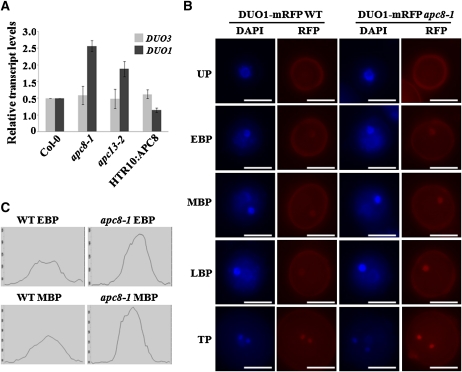
Figure 7.
Increased DUO1 Expression in apc8-1 during Male Gametophyte Development.
(A) Expression of DUO1 and DUO3 in mature pollen from Col-0, apc8-1, apc13-2, and HTR10:APC8 as determined by qPCR. UBIQUITIN5 (UBQ5) was the loading control. All measurements represent the average of three biological replicates with error bars representing the se.
(B) Expression of pDUO1:DUO1-mRFP in the wild type and apc8-1. Plants homozygous for pDUO1:DUO1-mRFP were crossed into apc8-1 and then F3 plants homozygous for both apc8-1 and pDUO1:DUO1-mRFP were analyzed. One example for each developmental stage is shown. All images were acquired using the same exposure times. UP, unicellular pollen; EBP, early bicellular pollen; MBP, middle bicellular pollen; LBP, late bicellular pollen; TP, tricellular pollen. Bar = 10 μm.
(C) Quantitative data of RFP signal intensity at the early bicellular pollen and middle bicellular pollen stages in (B) is shown. Each x axis represents a 5-μm distance centered on the fluorescent focus. WT, wild type.
[See online article for color version of this figure.]

