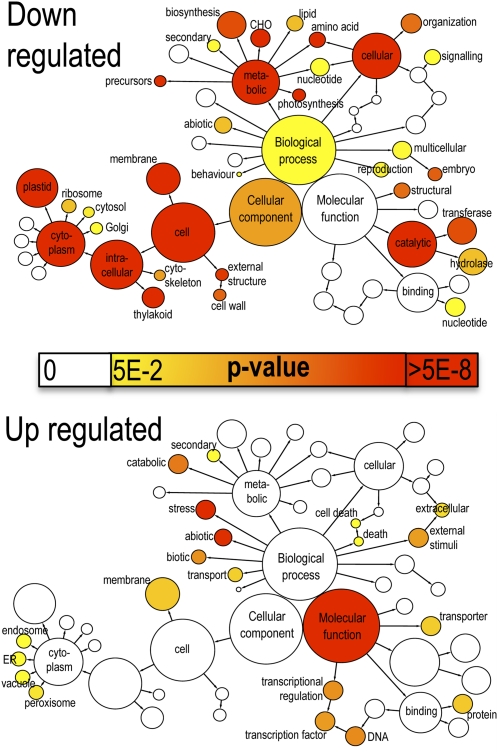
Figure 4.
Enriched GO Terms in Genes Upregulated and Downregulated during Senescence.
The network graphs show BiNGO visualization of the overrepresented GO terms for the combined clusters of genes either downregulated (clusters 1–24, 2849 genes) or upregulated (clusters 27–48, 3292 genes) during senescence. Categories in GoSlimPlants (Maere et al., 2005) were used to simplify this analysis and the same nodes are shown on both graphs. Uncolored nodes are not overrepresented, but they may be the parents of overrepresented terms. Colored nodes represent GO terms that are significantly overrepresented (Benjamini and Hochberg corrected P value < 0.05), with the shade indicating significance as shown in the color bar. A more detailed analysis of the GO categories is shown in Supplemental Table 1 online. ER, endoplasmic reticulum.

