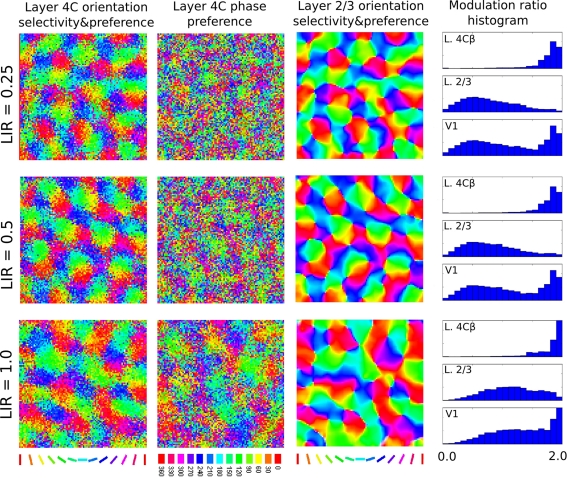
Figure 10.
This figure demonstrates the influence of the strength of the lateral interaction in layer 4C relative to the strength of lateral interaction in layer 2/3 (the LIR index). Each row shows the results of a simulation run with a different LIR. The main properties of the model do not change if we add weak lateral connectivity to layer 4C, but adding strong lateral connectivity to layer 4C causes phase clustering in layer 4C, reducing phase invariance in layer 2/3 (notice how the MR histogram shifts in the “simple-cell” direction for L2/3 cells as LIR increases).

