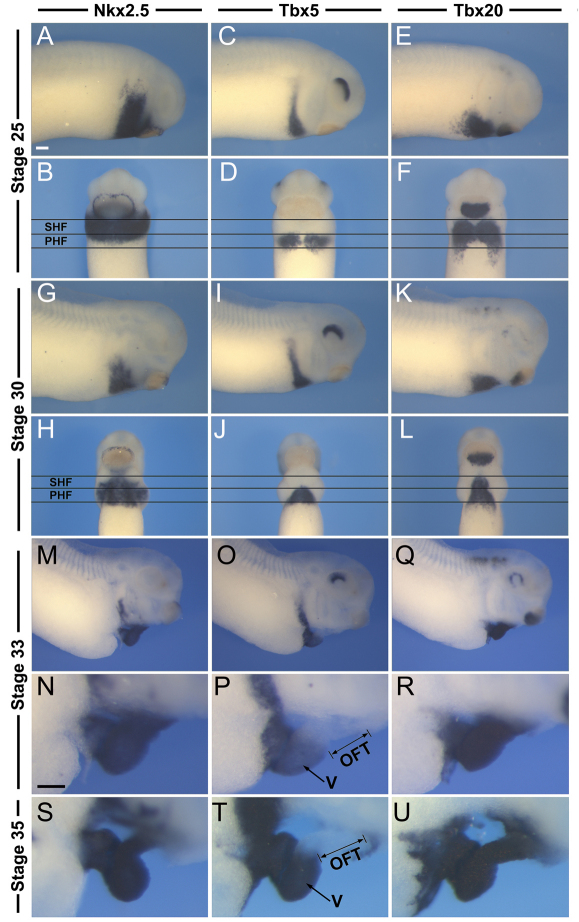
Fig. 3.
Molecular characterization of the primary and second heart fields. (A-U) Developmental expression of Nkx2.5, Tbx5 and Tbx20 at stages 25, 30, 33 and 35 as indicated. The horizontal lines indicate the predicted position of primary heart field (PHF) and second heart field (SHF). All three genes are detected in the PHF, whereas the SHF expresses both Nkx2.5 and Tbx20 but is negative for Tbx5 expression. At later stages, the developing outflow tract (OFT), a derivative of the SHF, remains Tbx5 negative. (A,C,E,G,I,K,M-U) Lateral views, anterior to right. (B,D,F,H,J,L) Ventral views, anterior to top. V, ventricle. Scale bars: 100 μm.

