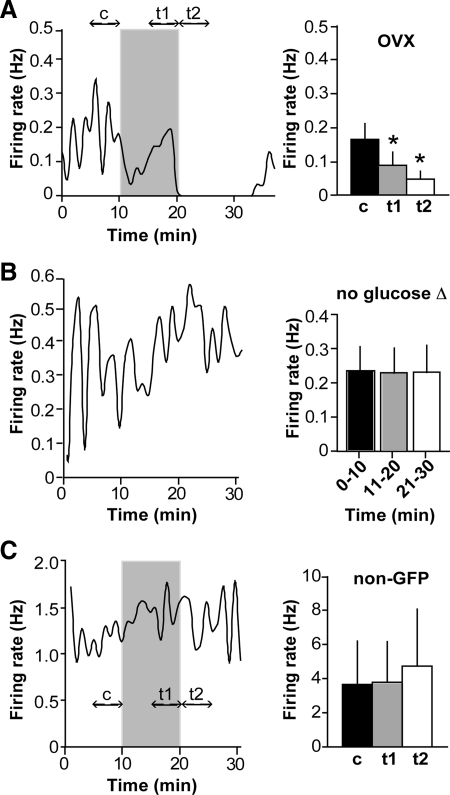
Fig. 1.
GnRH neurons are sensitive to a physiological reduction in extracellular glucose concentration. A, Representative plot of firing rate over time in a GnRH neuron from an OVX mouse (left) and summary (n = 11 cells, right). Firing events are binned in 60-sec intervals. Glucose concentration was switched from 4.5 to 0.2 mm; shaded region indicates period of 0.2 mm treatment. Double-headed arrows indicate time intervals in which frequency was averaged for analysis, designated c for control period, t1 for low glucose, and t2 for post-low glucose. Mean ± sem firing rates for c (black bars), t1 (gray bars), and t2 (white bars) are shown in the bar graph. B, Representative plot of firing rate over time in a cell from an OVX mouse in which the glucose concentration was held constant at 4.5 mm (left), and summary (n = 6 cells, right). There was no change in average firing rate over time, in contrast to cells in which the glucose concentration was reduced. C, Representative plot of firing rate over time in a non-GFP-expressing neuron in the preoptic area (left), and summary (n = 5, right). Time of 0.2 mm glucose treatment is indicated by shading. Low glucose failed to affect firing in five of five non-GFP (non-GnRH) neurons. *, P < 0.05.

