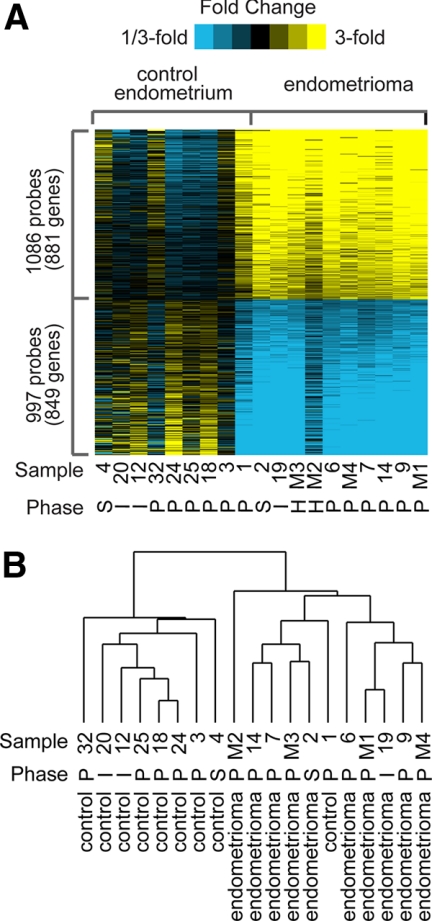
Fig. 2.
Expression profiling of genes in nonendometriosis control endometrium and endometriomas. A, Heat map representation of transcripts overexpressed (yellow) and underexpressed (blue) in control endometrium vs. endometriomas (P < 0.01, fold change >1.5). Menstrual cycle phase is indicated by S, secretory; I, interval; P, proliferative; or H, prior hysterectomy. Rows, Transcripts; columns, profiled samples. B, Hierarchical clustering of control endometrium and endometriomas. Menstrual cycle phase is indicated.

