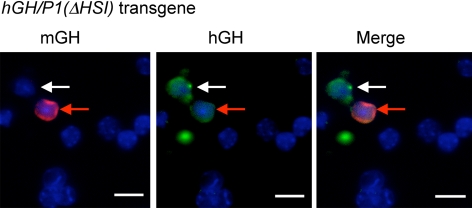
Fig. 2.
Inactivation of HSI results in a relaxation of hGH-N somatotrope restriction. Cells from an hGH/P1(ΔHSI) pituitary were stained for hGH and mGH, and the nuclei were counterstained with DAPI (blue). The representative field shows an example of a cell that is hGH positive and mGH negative (white arrows) as well as a cell that costains for both mGH and hGH (red arrows). The overall frequency at which hGH is expressed in mGH-negative cells is summarized in Table I. A parallel analysis of hGH/P1 mice failed to reveal evidence for ectopic expression using similar levels of signal enhancement (data not shown). Scale bars, 10 μm.

