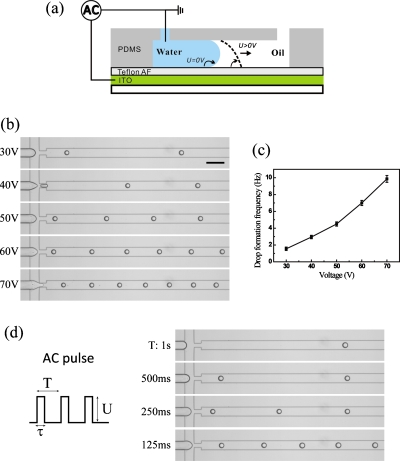
Figure 1.
(a) Schematic side-view illustration of EW-based FFD. When a voltage is applied, the water-oil interface is pulled to the downstream. (b) Drop formation occurs only above a threshold voltage. Increasing Urms further, the drop formation frequency (k) increases while the drop size remains constant. The scale bar is 200 μm. (c) k as a function of Urms. (d) Control over k at fixed Urms by using ac pulses with variable intervals (enhanced online). [URL: http://dx.doi.org/10.1063/1.3570666.1] [URL: http://dx.doi.org/10.1063/1.3570666.2] [URL:http://dx.doi.org/10.1063/1.3570666.3] [URL: http://dx.doi.org/10.1063/1.3570666.4]

