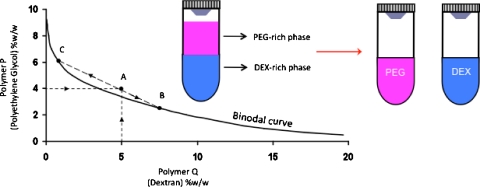
Figure 1.
Polymeric ATPS. A typical phase diagram of an ATPS comprising PEG (Mw: 8 K) and DEX (Mw: 500 K). Only those combinations of the two polymers P (PEG) and Q (DEX) above the binodal curve give an ATPS. Point A represents the initial concentration of each polymer in the entire solution, whereas points B and C describe the compositions of bottom and top phases in equilibrium, respectively. Line BC represents a tie line and is a unique property of the given ATPS.

