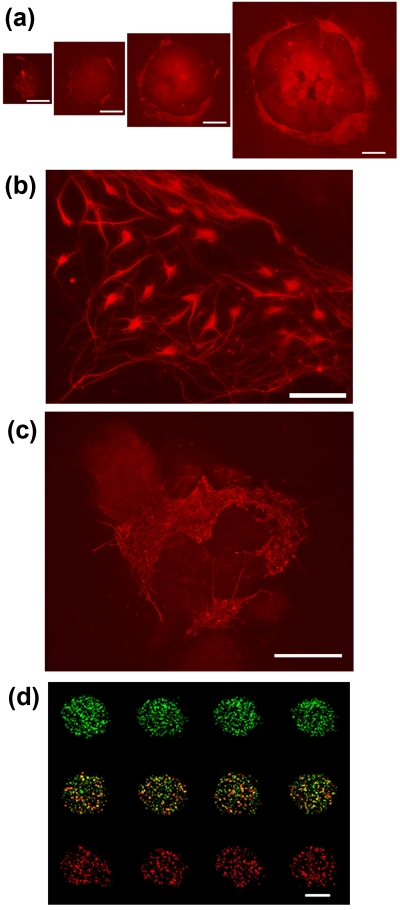
Figure 4.
ATPS Microprinting for cell fate and function. (a) Size-dependent neuronal differentiation of individual mESC colonies resulting from printing different densities of mESC on feeder PA6 cells. (b) High magnification image of lower left corner of the third largest colony of panel (a). (c) Enhanced differentiation of interspaced small mESC colonies on a PA6 feeder island. (d) Multiplexed genetic materials printing on HEK293H cell clusters from a monolayer results in a spatially defined gene expression pattern. The concentration of GFP and dsRed plasmids in the clusters of the middle row is each half of that in the top and bottom rows. Scale bar 500 μm in (a), 100 μm in (b), 250 μm in (c), and 700 μm in (d). [Panel d adapted with permission from NPG (Ref. 28)].

