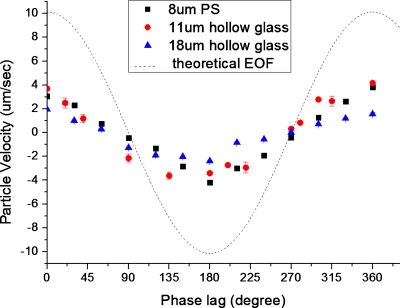
Figure 9.
Variation of particle velocity with the change in phase lag between the driving and gate voltage for a 8 μm polystyrene and 11 and 18 μm hollow glass particles when the driving electric field and gate signals are kept at 2.5 kV/m and 700 V, respectively. The theoretical velocity of the fluid flow is shown as the dotted line.

