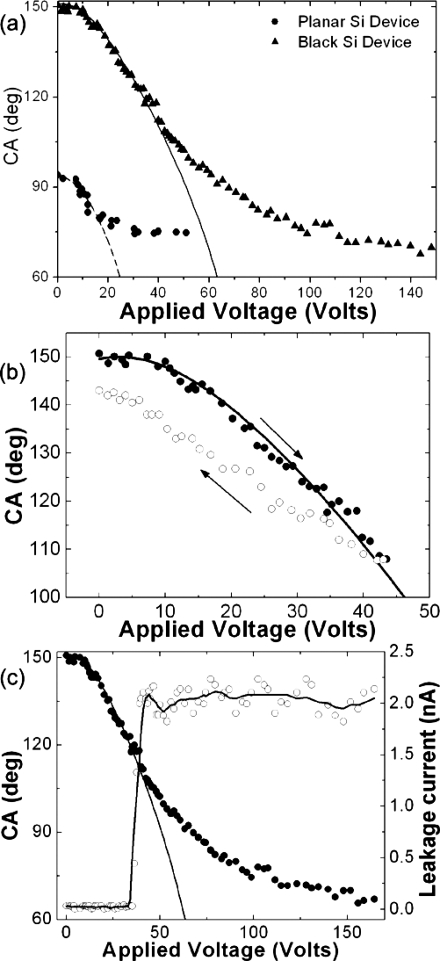
Figure 10.
(a) Contact angle of an 85% glycerol drop as a function of applied voltage for (a) a flat (solid circles) and a black Si surface (solid triangles) of a laser fluence of 1.69 J∕cm2. The lines represent the fits to Eqs. 1, 3 with parameters shown in the text. (b) Reversibility of the EWOD effect; the arrows indicate the decrease∕increase of the applied bias, respectively. (c) CA (on the left y-axis) and leakage current (on the right y-axis) dependence on the applied voltage. The solid line is a fit to Eq. 3 with parameters shown in the text; the dashed line is a guide to the eye.

