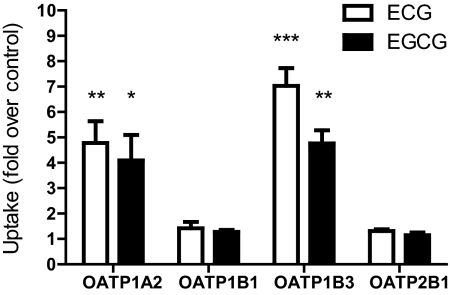
Fig. 5.
Uptake of green tea catechins by OATPs. Cells were incubated with 100 μM ECG or EGCG at 37°C for 10 min. Uptake by each OATP-expressing cell line was divided by the uptake by its appropriate control cell and is expressed as fold uptake over control. Each value represents the mean ± S.D. of at least two experiments performed in triplicate. Asterisks represent statistically significant uptake compared with control cell lines (*, p < 0.05; **, p < 0.005; ***, p < 0.001).

