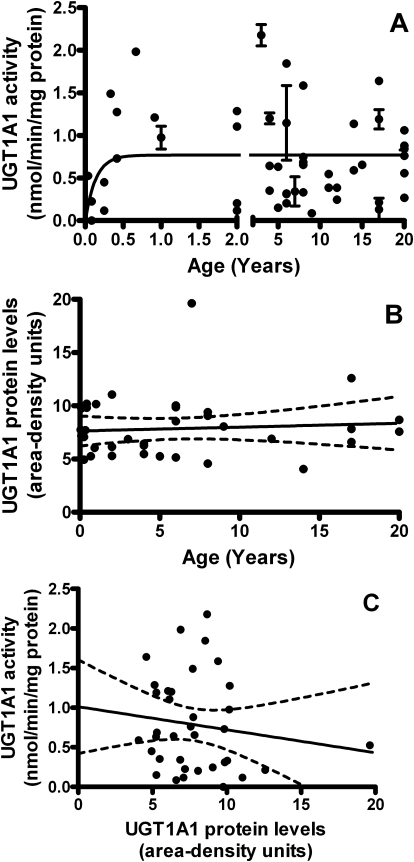
Fig. 1.
The development of UGT1A1 in the pediatric liver. A, activity toward 125 μM bilirubin increased with age. Model returned an activity of 0.7848 pmol · min · −1mg protein−1 at birth that increased to apparent maximal adult activity at 0.7690 ± 0.081 nmol · min · −1mg (95% CI, 0.6028–0.9351). The 90th percentile of activity was reached at 3.8 months of age (r2 = 0.04748, absolute sum of squares = 13.52, Sy.x = 0.5363). Each point represents each sample read in triplicate ± S.E.M. The model is unweighted and constrained by medium convergence criteria requiring five consecutive iterations of the fit to change the sum-of-squares by less than 0.0001%. B, protein levels did not correlate with age. Two-tailed Pearson correlation returned p = 0.6589 and r2 = 0.005801. C, protein levels did not correlate with enzyme activity. Two-tailed Pearson correlation returned p = 0.4104 and r2 = 0.02002. Band intensities were calculated using ImageJ software (National Institutes of Health) and were normalized to the pooled samples on each Western blot.

