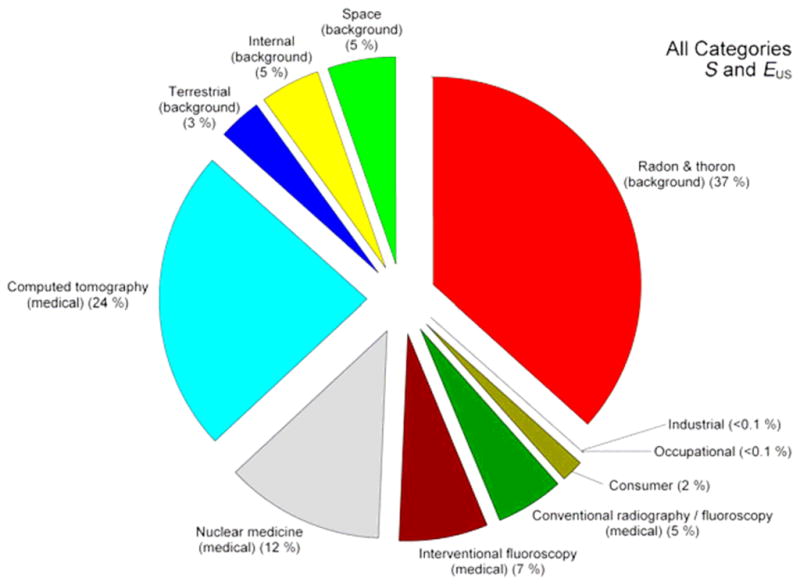
Figure 1.

Percent contribution of various sources of exposure to the total collective effective dose (1,870,000 person-Sv) and the total effective dose per individual in the U.S. population (6.2 mSv) for 2006. Percent values have been rounded to the nearest 1%, except for those <1%. Figure is reproduced from NCRP Report 160 (NCRP 2009).
