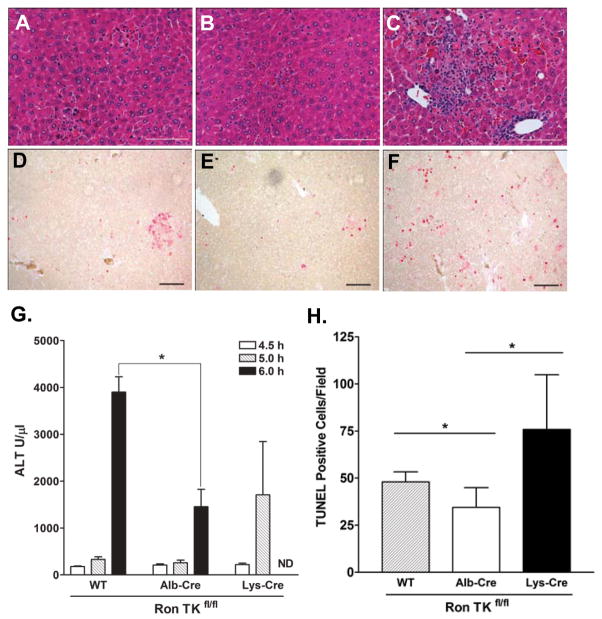
Figure 7. Deletion of the Ron TK domain in hepatocytes is protective whereas deletion in myeloid derived cells is detrimental to mice treated with LPS/GalN.
Histopathology of LPS/GalN mice after 5 hours: (A) Ron TKfl/fl, (B) Alb-Cre Ron TKfl/fl, (C) Lys-Cre Ron TKfl/fl. (D, E, F) Representative TUNEL stained slides (bar=100 μm), positive nuclei stained red. (D) Ron TKfl/fl, (E) Alb-Cre Ron TKfl/fl, (F) Lys-Cre Ron TKfl/fl. (G) Plasma ALT levels of LPS/GalN treated mice at 4.5, 5, and 6 hours. At 6 hours, Ron TKfl/fl control mice had significantly higher ALT than Alb-Cre Ron TKfl/fl mice (*P<0.05). ND, not determined as Lys-Cre mice were moribund or dead at 6 hours. (H) Positive TUNEL counts per 100X field. *P<0.05

