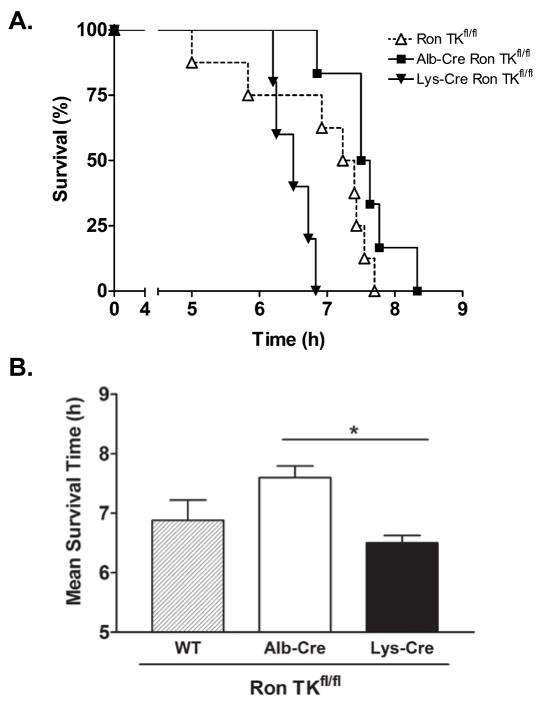
Figure 8. Alb-Cre Ron TKfl/fl and Ron TKfl/fl mice have a survival advantage over Lys-Cre Ron TKfl/fl mice treated with LPS/GalN.
(A) Kaplan-Meier survival graph of mice injected with LPS/GalN. Lys-Cre Ron TKfl/fl n=5, Ron TKfl/fl n=8, Alb-Cre Ron TKfl/fl n=6. Survival of the Lys-Cre Ron TKfl/fl mice was significantly less than the other two groups. Logrank test P=0.005. (B) Comparison of survival times in hours. *P<0.05 between Alb-Cre and Lys-Cre mice.

