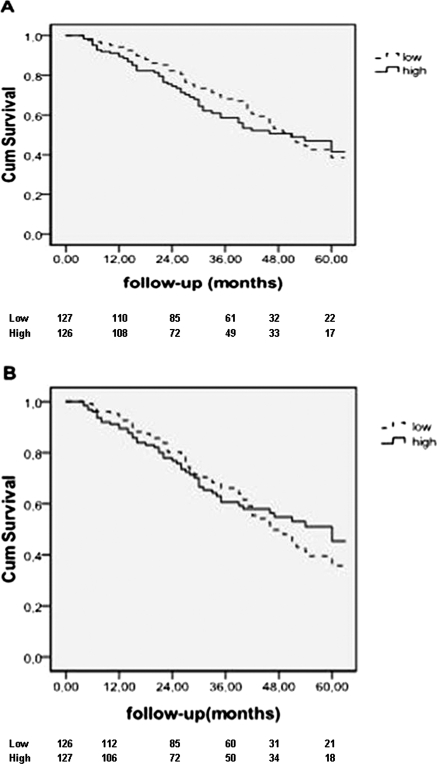
Figure 1.
Kaplan-Meier survival curves for patients with low and high peritoneal clearance of albumin (A) and albumin loss (B) (intention-to-treat analysis). The number of patients at risk is given below the horizontal axis. The difference between the two groups was not significant (log rank test, P = 0.51 and 0.69, respectively).

