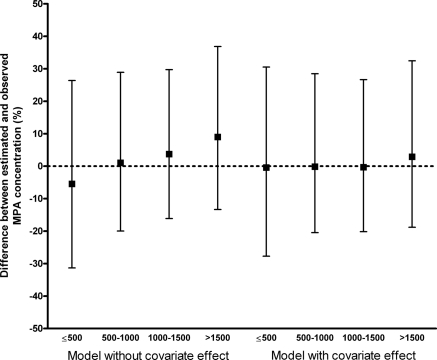
Figure 5.
External validation. Median and interquartile range of the difference between the estimated and observed MPA concentrations in the external validation data set. The differences are represented for several MMF doses, after estimations with the final model (right) and the model in which the correlation between MMF dose and bioavailability is not included (left).

