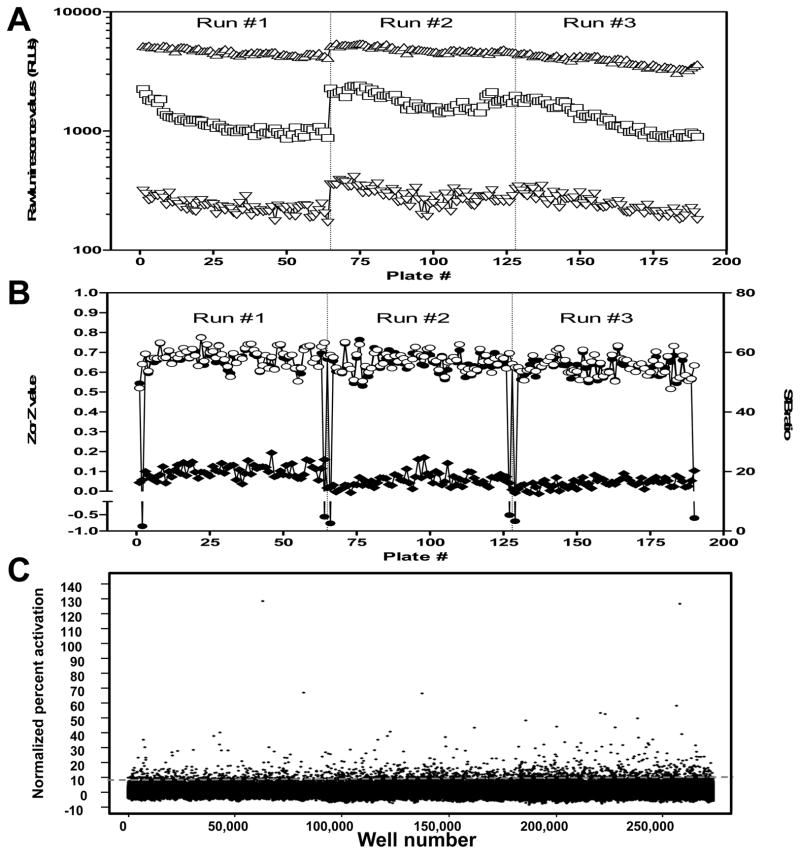
FIG. 3.
Wee1-Luc primary uHTS campaign performance.
(A) Scatter plot of the raw RLU values of intra-plate controls during the K328M-Wee1-Luc primary screen. One hundred and ninety 1536-well plates were run on the automated robotic platform of the Scripps Research Institute Molecular Screening Center. Plates were run in three separate batches noted Run #1, 2 and 3. Designated control wells on each plate received either 30 μM MG132 (High Control, △), 3 μM MG132 (Medium Control, □) or DMSO only (Low Control, ▽). (B) Scatter plot of the calculated Z, Z′ and S/B values of the K328M-Wee1-Luc primary screen. Low and High Control wells raw values were used to calculate the signal-to-background ratio (◆, right Y-axis) and the Z′ value (○, left Y-axis). Z values (●, left Y-axis) were calculated in reference to High Control wells and wells within the sample field of the assay plate. The low Z values observed at the beginning and at the end of each run are typical of the use of a concentration-response control plate. Indeed, each run was starting and finishing with a series of three control plates, respectively a first plate containing DMSO only in the sample field, a second one containing a 10-point, 3:2 serial dilution of MG132 starting at 30 μM a third plate identical to the first one to check for carry-over. (C) Scatter plot of the normalized percent activation of test compounds (n=218,180, 5 μM test concentration). The dashed grey line represents the hit-cutoff, which was calculated at 8.82% activation. Selected hits correspond to test compounds located above the dashed line.

