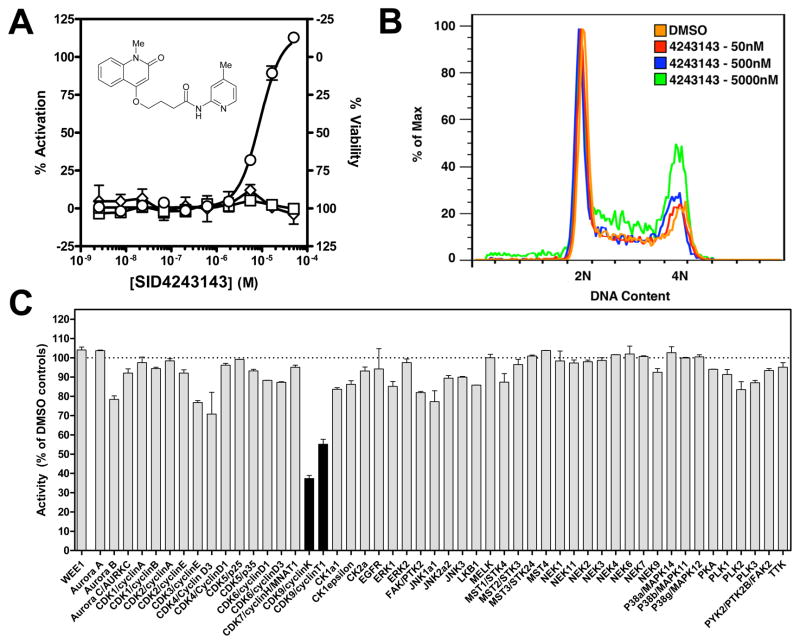
FIG. 5. Characterization of SID4243143.
(A) Titration results of SID4243143 in the Wee1 (○), N-cyclin B (□) and viability (◇) assays. Note the limited cytotoxicity and activity in the N-cyclin-B assay at higher test concentrations. Data points represent mean ± SD (n=3). (B) FACS analysis on HeLa cells treated for 20 hours with various concentrations of SID4243143 or DMSO alone. Note the dose-dependent increase in the G2/M population. (C) Profiling of SID4243143 against a panel of mitotic kinases. Black bars indicate activities lower than the average of activities measured for all kinases minus three times their standard deviation. Error bars represent the standard deviation (n=2).

