
Figure 2.
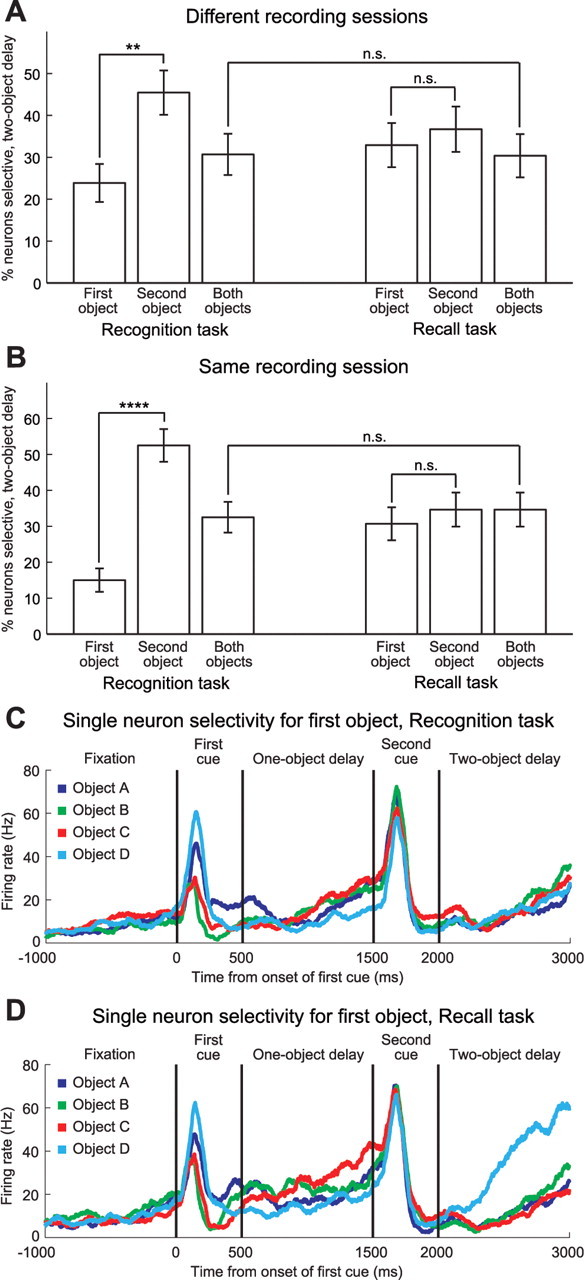
Strength of object representations. A, The proportion of the neural population representing only the first object, only the second object, or both objects during the two-object memory delay. In the recognition task, twice as many neurons represented the second object as the first object. In the recall task, the first and the second objects were represented equally. In both tasks, about one-third of the population represented both objects. n.s. indicates not significant, **p < 0.01, and ****p < 0.0001. Error bars indicate SE. B, The same analysis, with the same conclusions, repeated for the switching task. C, A single neuron recorded during the recognition task, trials grouped according to which object was used as the first cue. This neuron showed little selectivity for the first object at any point during the trial. D, The same neuron recorded during the recall task, trials again grouped by the first object. The same neuron showed strong selectivity for the first object during the two-object delay when the monkey performed the recall task.