
Figure 4.
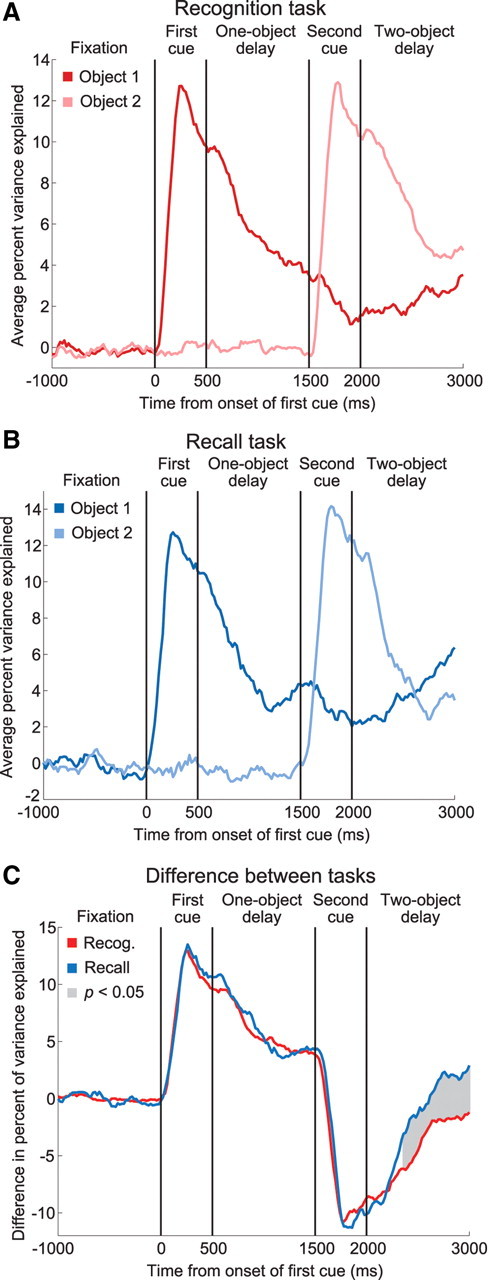
Relative object strengths during interleaved blocks of the recognition and recall tasks. A, The percentage variance explained by the first or the second object during the recognition task, averaged across the population of neurons. Again, these neurons show a stronger representation of the most recently seen object. B, The same analysis during the recall task. As seen during the separate recording sessions, the neurons show a weaker representation of the most recent object during this task. C, The object 1 curve minus the object 2 curve for both tasks. Even though the monkeys were switching between the tasks frequently, the task had a significant effect on the relative strengths of the objects.