
Figure 5.
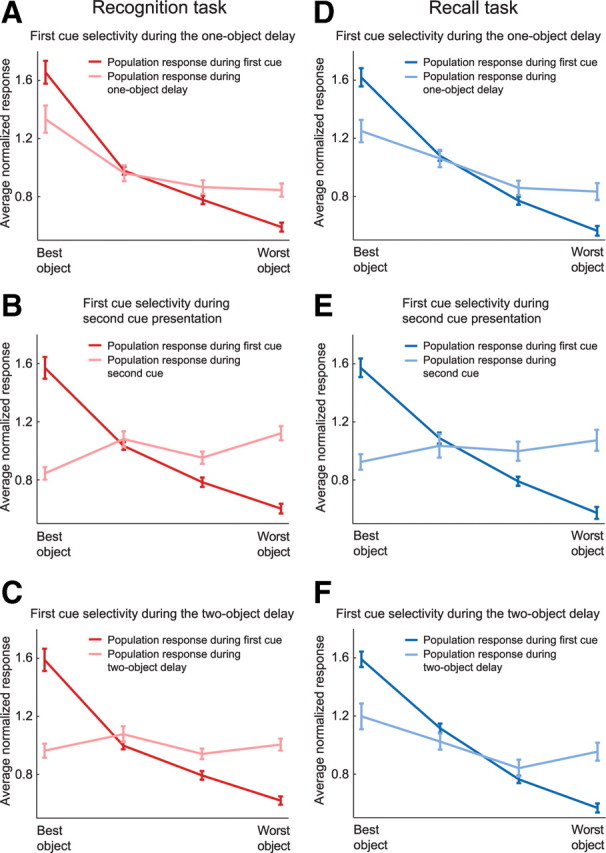
A–C, Recognition task. A, Normalized response of each neuron to the first object during both the first cue period (red) and the one-object delay period (pink), averaged across the population of selective neurons, ordered best to worst object as defined by the response during the first cue period. The population maintains its object preferences during the one-object delay period. B, Response to the first object during both the first cue period (red) and the second cue period (pink). The inversion of the slope shows that many neurons have changed preferred first objects. C, Response to the first object during both the first cue period (red) and the two-object delay period (pink). The flattening of this curve shows that many neurons have changed preferred first objects, but, when averaged together, the responses produce a flat line. D–F, Recall task. The same analysis as in A–C is shown, using data obtained during the recall task. D, Response to the first object during the first cue period (dark blue) is similar to the response to this object during the one-object delay (light blue). E, The response to the first object during the second cue period is flattened, indicating a change in selectivity. F, The response to the first object during the two-object delay period has a positive slope again, reflecting the reacquisition of initial object preferences as seen during cue presentation.