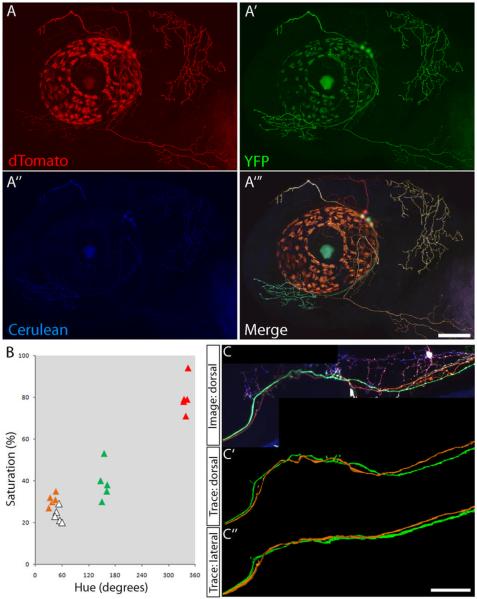
Figure 2. Brainbow assisted tracing of trigeminal sensory neuron central axons.
Trigeminal sensory neurons were labeled by transient expression of Islet1-Brainbow. (A–A‴) A 2-d-old larva with trigeminal sensory neurons labeled in different colors. Confocal images were acquired in the dTomato (A), YFP (A′), and Cerulean (A″) channels. These channels are combined to generate a color image (A‴). The distinct peripheral axon territories can be discerned based on their color (white, red, green, and orange). (B) To ensure that color separation is consistent throughout the length of the axon, the color of each neuron is defined quantitatively. The hue and saturation of randomly selected points along different axons are measured in Adobe Photoshop and plotted. Points from different neurons, colored to match the image in A, form distinct clusters on the graph. This indicates that the color separation in axons correctly reflects separate cellular origins. (C) Trigeminal central axon of the same larva at 5 d of development, imaged dorsally. (C′–C″) The green and orange axons are traced digitally and viewed dorsally and laterally. Scale bars, 50 μm.

