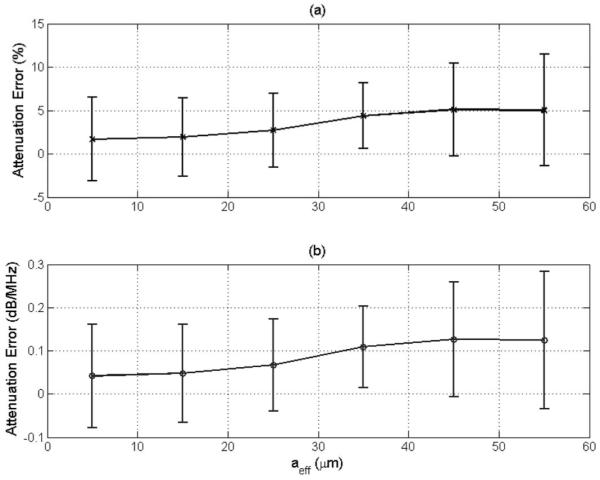
Fig. 3.

Plot of mean and standard deviation of error in attenuation slope in (a) percent and in (b) decibels per megahertz versus the effective radius of the scatterers in the half-space for the SS algorithm. The window length used in this simulation was 6.6 mm, and 50 independent echoes were used when estimating the power spectra. The error bars correspond to one standard deviation above and below the mean value.
