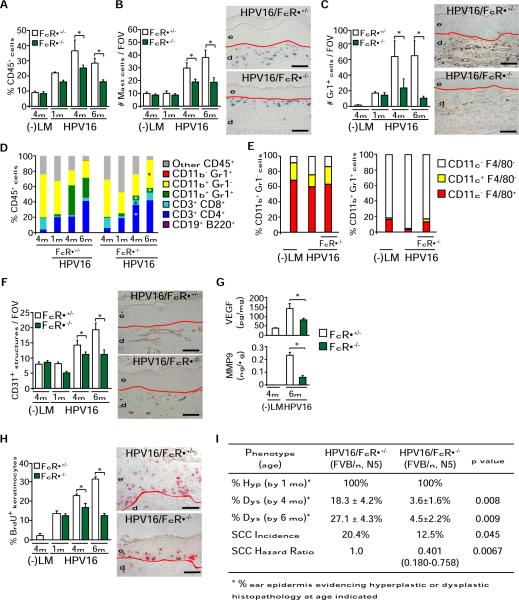
Figure 4. FcRγ Expression Is a Critical Determinant of Squamous Carcinogenesis in HPV16 Mice.
(A) Percentage of CD45+ cells in skin of HPV16/FcRγ+/− and HPV16/FcRγ−/− mice at 1, 4, and 6 months assessed by flow cytometry.
(B and C) Mast cells (B, blue staining) and Gr1+ myeloid cells (C, brown staining) in skin of HPV16/FcRγ+/− and HPV16/FcRγ−/− mice at 1, 4, and 6 months of age assessed quantitatively after chloroacetate esterase histochemistry or Gr1 IHC, respectively.
(D) Flow cytometric analysis of immune cell lineages as percentages of total CD45+ leukocytes in single-cell suspensions from nontransgenic, HPV16/FcRγ+/−, and HPV16/FcRγ−/− transgenic skin at 1, 4, and 6 months of age.
(E) Dendritic (CD11c+) and macrophage (F4/80+) cell composition in CD11b+Gr1+ and CD11b+Gr1− myeloid populations evaluated by flow cytometry of single cell suspensions derived from skin of negative littermate (−LM), HPV16, and HPV16/FcRγ−/− mice at 4 months of age.
(F) Attenuated angiogenesis in premalignant skin of HPV16/FcRγ−/− mice. Density of angiogenic vasculature evaluated quantitatively by CD31 IHC (brown staining) on age-matched tissue sections.
(G) Reduction in total VEGF-A and active MMP-9 protein levels in skin tissue extracts from age-matched HPV16/FcRγ−/− and HPV16/FcRγ+/− mice as determined by ELISA.
(H) Keratinocyte proliferation evaluated as percentage of bromodeoxyuridine (BrdU)-positive keratinocytes (red staining) in ear skin tissue sections representing age-matched negative littermate (−LM), HPV16/FcRγ+/−, and HPV16/FcRγ−/− premalignant skin.
(I) Percentages of ear skin (area) exhibiting hyperplasia by 1 month of age (Hyp) or dysplasia by 4 or 6 months of age (Dys). Values represent percentages of mice with specific neoplastic phenotypes. Statistical significance was determined using the Mann-Whitney test. Lifetime incidence of SCC was determined in HPV16/FcRγ+/− and HPV16/FcRγ−/− mice (97 and 132 mice/group, respectively). Tumor incidence was analyzed with the generalized Wilcoxon test. Hazard ratio was determined by Kaplan Meyer analysis of tumor incidence. All mice reflect similarly backcrossed groups at FVB/n, N5.
(A–H) Results shown represent mean ± SEM (n = 5–8 mice) and asterisks (*) indicate statistically significant differences (p < 0.05, Mann-Whitney). Values represent average of five high-power fields of view per mouse. Representative images of HPV16/FcRγ+/− and HPV16/FcRγ−/− skin tissue sections at 4 months of age are shown. Red line, epidermal-dermal interface; e, epidermis; d, dermis. Scale bars represent 50 μm. See also Figure S3.

