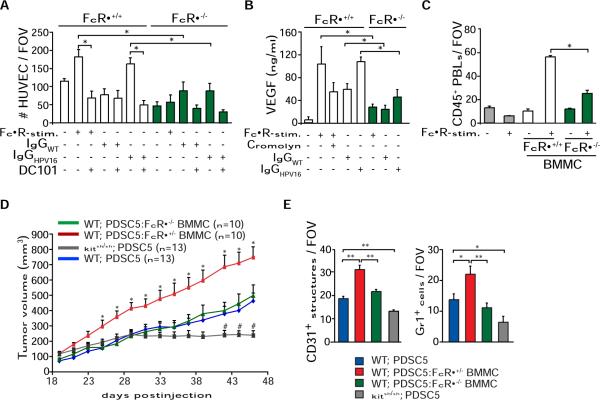
Figure 5. Activating FcγRs Regulate Protumor Functions of Mast Cells.
(A) FcγR-dependent chemotaxis of HUVECs in response to FcγR-stimulated mast cells isolated from FcRγ+/− or FcRγ−/− mice. BMMCs were stimulated with 2.4G2 and anti-rat IgG (25 μg/ml; FcγR-stim.), IgGHPV16, or IgGwt (30 μg/ml). HUVEC migration in response to conditioned medium was assessed using a Boyden chamber assay. A specific VEGF-R2 inhibitor (DC101; 100 μg/ml) was used. HUVEC migration was quantitated by enumerating the number of migrating cells in four random fields per membrane (125× magnification). Samples were assayed in quadruplet for each assessed condition.
(B) BMMCs from FcRγ+/− or FcRγ−/− mice were FcγR stimulated or activated with IgGHPV16 or IgGwt in the presence or absence of the mast cell stabilizer cromolyn (10 μM). Levels of VEGF-A in conditioned medium were assessed by ELISA. Representative analysis from three independent experiments is shown.
(C) PBL migration in response to conditioned medium from FcRγ+/− versus FcRγ−/− BMMCs after FcγR stimulation was evaluated with a Boyden chamber assay. PBLs migrating to the lower chamber were visualized by H&E staining in five to eight random fields per well. Samples were assayed in triplicate for each tested condition.
(D) FcRγ-proficient mast cells enhance tumorigenicity. PDSC5 tumor cells (blue) alone or admixed with FcRγ+/− (red) or FcRγ−/− (green) BMMCs were injected s.c. into FVB/n (WT) or kitsh/sh (gray) mice at a 1:1 ratio. The asterisk (*) indicates statistically significant differences between PDSC5 cells in combination with FcRγ+/− versus FcRγ−/− BMMCs. The number sign (#) indicates statistically significant differences between tumor growth in syngeneic FVB/n or kitsh/sh mice.
(E) FcRγ-proficient mast cells induce angiogenesis and leukocyte infiltration of transplantable tumors. Blood vessels and leukocyte infiltration were evaluated by CD31 and Gr1 IHC. Values represent average of five high-power fields of view per tumor and six to ten tumors per category.
(A–E) Data are represented as means ± SEM; *p < 0.05; **p < 0.01 (unpaired t test).

