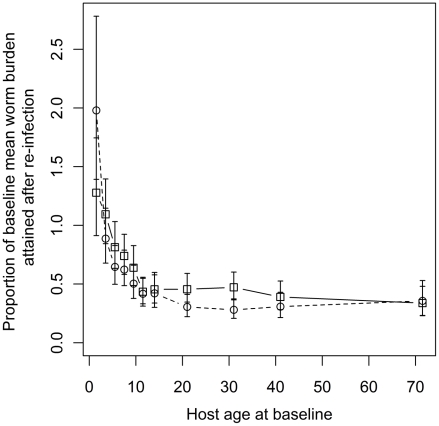
Figure 3. The proportion of the baseline mean worm burden after six months re-infection vs. host age.
Fitted points are posterior means estimated from the “full” model (Model 1, see Table 3). Squares and solid lines denote the first re-infection population, circles and dashed lines the second re-infection population. Error bars represent 95% Bayesian credible intervals.

