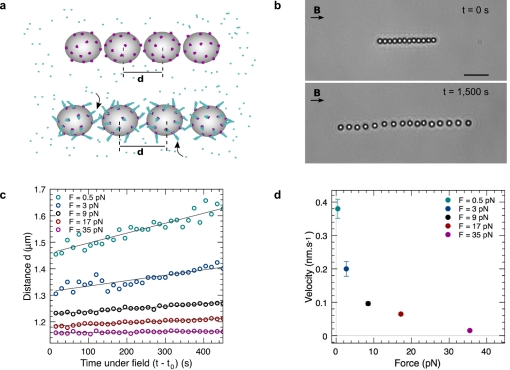
Figure 1. Experimental scheme and representative velocity versus force measurements.
(A) Schematics of the experiment: actin polymerization is initiated at the bead surface by gelsolin, and pushes the beads apart. (B) Bright-field images of a colloid chain, aligned under a 5-mT magnetic field, at two different times. Actin filaments are not dense enough to be seen. Scale bar, 5 µm. (C) Evolution of the center-to-center distance d with time for different loading forces. The distance increases linearly with time, allowing a direct measurement of the beads relative velocity. (D) Velocity versus loading force profile. Error bars indicate estimated error (standard deviation) from the slope determination in (C). For the largest forces, the error bars are smaller than the symbols. Number of filaments per particle: N GS = 10,000.

