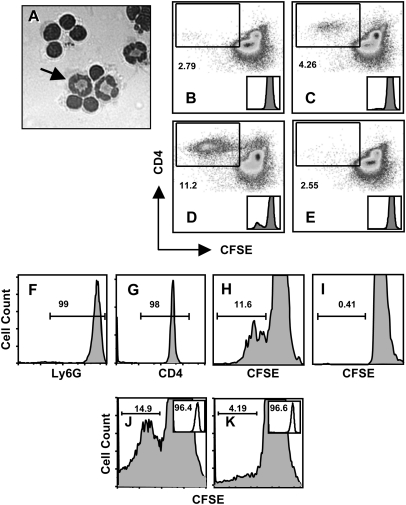
Fig. 5.
Neutrophils process and present antigen to stimulate T-cell proliferation. (A) Neutrophils were pre-incubated with OVA, then cells were added to OVA-specific OT-ll cells at a PMN to T cell ratio of 1: 10. Four days later, cells were examined under the microscope. The arrow points to one of three neutrophils in this image. In panels B–E, the ability of Percoll gradient-isolated neutrophils (97% purity) to stimulate immunomagnetic bead-isolated CD4+ T cell (98% purity) proliferation was examined. (B) Non-pulsed neutrophils induce low levels of OT-II T-cell proliferation in day 4 cultures as measured by CFSE dilution of labeled CD4+ T cells. (C) Proliferation of OVA-specific OT-II T cells after day 4 co-culture with neutrophils pre-incubated (4 h, 37°C) with whole OVA. (D) OT-II T cells proliferation after 4-day culture with OVA peptide-pulsed PMN. (E) Addition of anti-MHC class II blocking antibody (M5/114) prevents OT-II proliferation stimulated by OVA peptide-pulsed neutrophils. Insets in B through E show CFSE peak dilution histograms. Samples in B through E were incubated at a ratio of 10 T-cells for every one neutrophil. In panels F–I, the experiments were reiterated using flow sorted Ly6Ghigh neutrophils and CD4+ OT-II T cells. (F) Neutrophil purity after cell sorting (99% Ly6G positive). (G) Purity of OT-II T cells following cell sorting (98% CD4 positive). (H) Day 4 proliferation of sorted CFSE-labeled OT-II CD4+ T cells after incubation with sorted neutrophils pulsed with OVA peptide. (I) Proliferation of sorted OT-II T cells after incubation with non-pulsed sorted neutrophils. (J) Proliferation of OVA-specific OT-II T cells following incubation with OVA peptide-pulsed neutrophils from MHC class II expressing C57BL/6 mice. (K) Proliferation of CD4+ T cell following 4-day incubation with OVA peptide-pulsed neutrophils from MHC class II-deficient mice. Neutrophil purity, based on Ly6G expression, is shown in the inserts and was 96.4 and 96.6% in J and K, respectively. Samples in (F) through (K) were incubated at a ratio of five T-cells for every one neutrophil. Experiments in (A–D) were performed five times with the same result and the MHC blocking experiment (E) was performed three times with the same result. The cell sorting experiment (F–I) was performed three times and experiments with MHC class II KO cells were performed two times with the same result.

