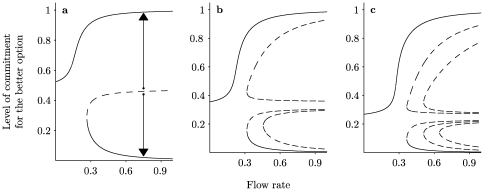
Figure 1. Bifurcation diagrams of  corresponding to the steady state level of commitment for the better option (eqs. (3) – (6))with respect to the flow rate
  .
.
(a) case  , (b)
, (b)  and (c)
  . Full and dashed lines correspond to stable and unstable solutions respectively. The stability has been checked numerically by integrating the full eqs. (1) – (2). The arrows indicate the evolution of initial conditions on the two sides of a threshold value corresponding to the intermediate unstable state. Parameter values are
  ,
,  ,
,  and
and  .
.

