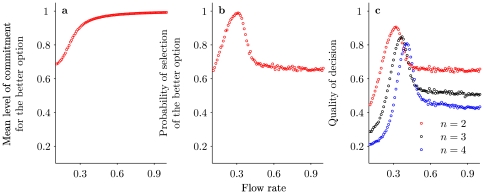
Figure 2. Quantitative view of the quality of decision as a function of the flow rate  as obtained by Monte Carlo simulations.
(a) Mean level of commitment for the better option  , (b) Probability of selection of the better option and (c) Quality of decision for three different numbers of options. Parameter values as in Fig. 1, number of realizations is 5000.

