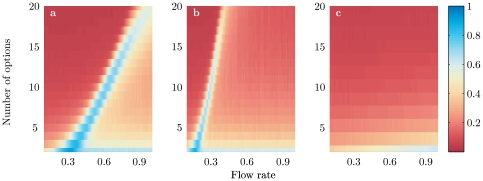
Figure 3. Decision quality as a function of the flow rate of individuals  and of the number of options
  as obtained by Monte Carlo simulations.
(a) case  , (b)
, (b)  and (c)
  . Other parameter values as in Fig. 1, number of realizations is 5000.

