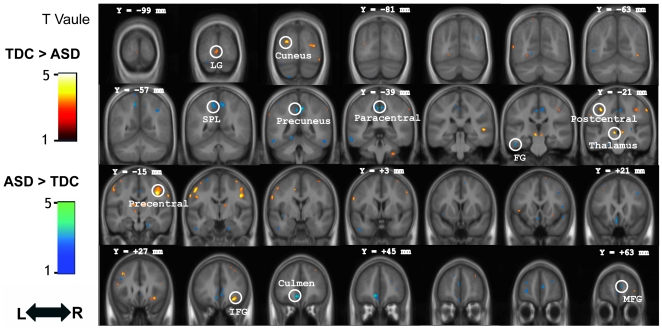
Figure 1. Direct comparison between groups controlling for age, IQ, and total gray matter volume.
The gray matter regions showing significant group differences between individuals with ASD and TDC are rendered onto the averaged coronal images of the whole sample (N = 50) (Voxel threshold: uncorrected P<0.001). The y-coordinate for each coronal slice in the Montreal Neurological Institute space is given in millimeters. L: left, R: right. Abbreviations: LG, lingual gyrus; SPL, superior parietal lobule; FG, fusiform gyrus; IFG, inferior frontal gyrus; MFG, medial frontal gyrus.

