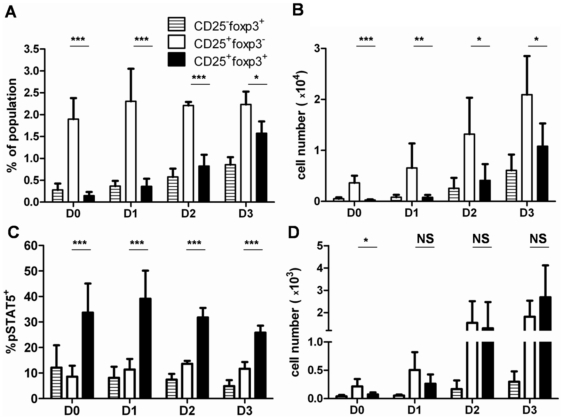
Figure 2. Kinetics of pSTAT-5 expression during Treg cell differentiation in the neonatal thymus of C57BL/6 mice.
(A–B) Frequencies (A) and absolute numbers (B) of CD4+CD8− cells of the indicated phenotype defined by CD25 and foxp3 expression in the thymus of C57BL/6 neonates at the indicated days after birth. For sake of clarity, analysis of CD25−foxp3− cells which encompass >90% of all CD4+ T cells, is not included in the figure (C–D) Frequencies (C) and absolute numbers (D) of pSTAT-5+ cells within CD4+CD8− thymic subsets defined by CD25 and foxp3 expression in C57BL/6 neonates at the indicated days after birth. The p values are indicated in each panel (***p<0.001; **p<0.01; *p<0.05; NS not significant). Results shown are the compilation of 2 independent experiments with 6 to 8 mice analyzed per day. For sake of clarity, only the p values comparing CD25+foxp3− and CD25+foxp3+ cells are shown.

