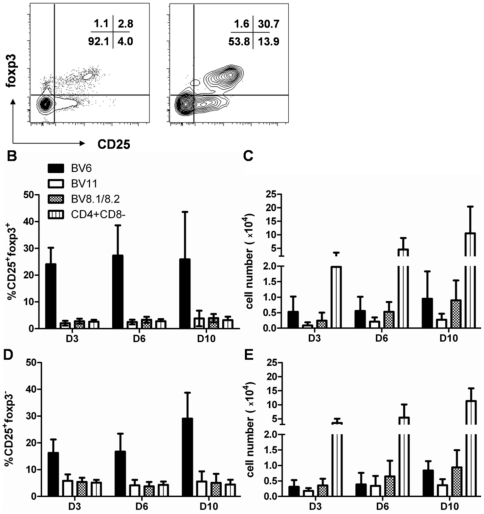
Figure 4. Enhanced selection of Mls-1a–specific T cells into the regulatory lineage in the thymus of C57BL/6×DBA/2 F1 neonates.
(A) Representative flow cytometry analysis of CD25 and foxp3 expression in BV6+ or BV6− cells among CD4+CD8− thymocytes of a F1 mouse at day 3 after birth. (B–E) Frequencies and absolute numbers of CD25+foxp3+ (B–C) or CD25+foxp3− cells (D–E) were determined in CD4+CD8− cells within the indicated TCR-expressing cells (BV6, BV11, BV8.1/8.2) from 3 to 21 mice at the indicated age after birth in B6D2 mice. Results shown are compiled from 17 independent experiments.

