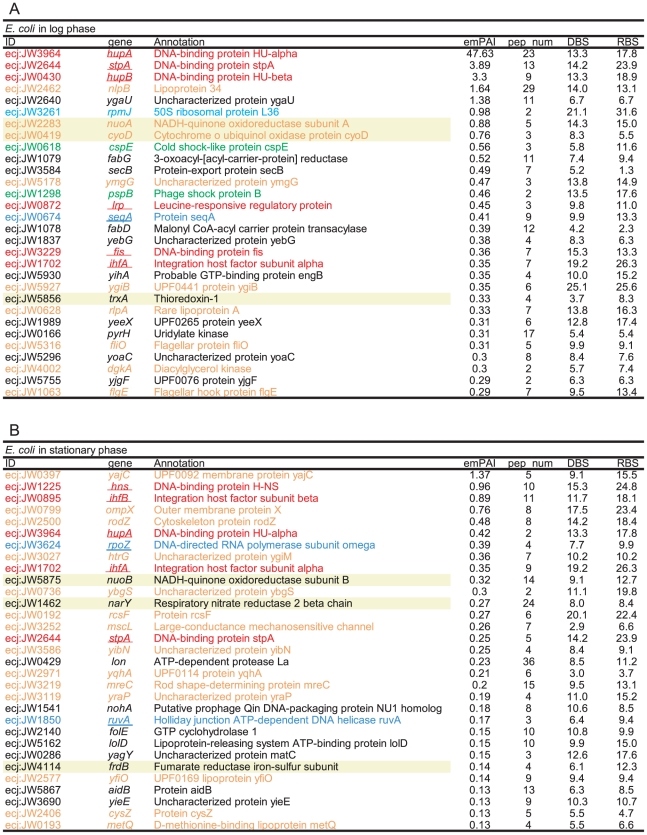
Figure 6. csNAPs of E. coli.
The listed proteins were the top 30 csNAPs sorted by the emPAI values. (A) log phase and (B) stationary phase. The meanings of the colors, letters, and underlines are the same as those for Figure 4. The proteins with a yellow background are the oxidation-reduction enzymes. DBS and RBS represent the number of DNA-binding sites and RNA-binding sites per amino acid predicted by BindN [88], respectively. Values over 10 indicate high possibilities to bind to DNA and/or RNA (see materials and methods).

