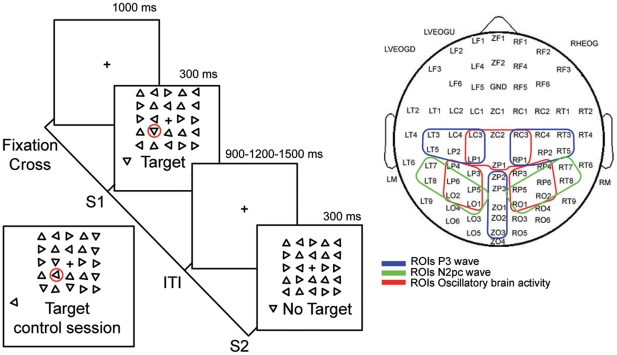
Figure 1. Schematic presentation of the task and electrode coverage over the scalp.
The left portion of the figure depicts the visual search task’s main sequence of events. At the beginning of each block a fixation cross was presented during 1000 ms, then S1 (target present) or S2 (target absent) are presented pseudo-randomly for 300 ms. Subjects then had 1200, 1500 or 1800 ms to respond by pressing either the left or right button of a mouse if the target was present or absent from the search array respectively. This was followed by a random duration ITI that could be 900, 1200 or 1500 ms long. The bottom left panel depicts an example of the target used during the control session. The right portion of the figure shows the electrode sites spanning frontal, central, temporal, parietal and occipital areas and the identified ROIs for ERPs and neural oscillatory activity analysis.

