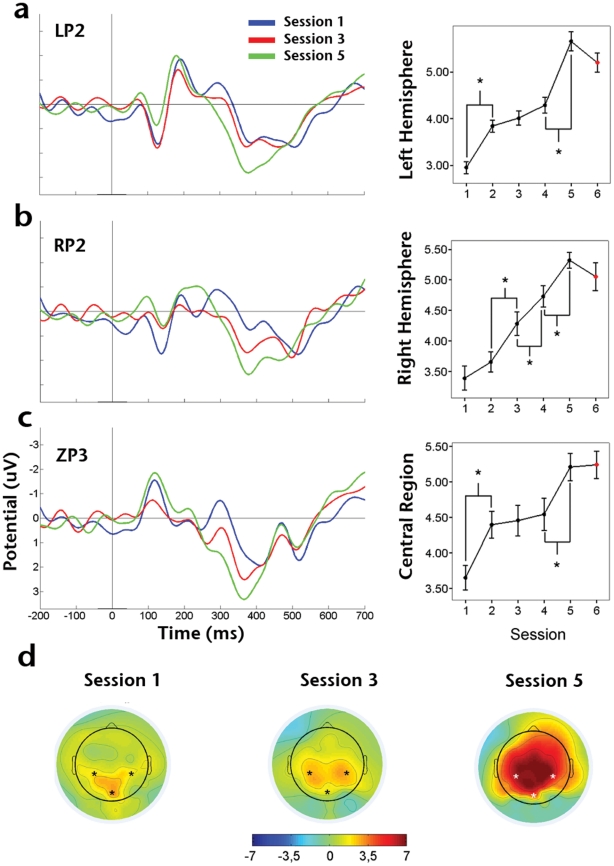
Figure 3. Effect of training over mean P3 amplitude.
Grand average ERPs obtained from session 1, 3 and 5 (sessions 2 and 4 are omitted for clarity) and from electrodes: A) LP2, left parietal; B) RP2, right parietal; C) ZP3, central mid-line. D) Average topographic distribution of scalp potential peak in the P3 time window for the corresponding sessions.

