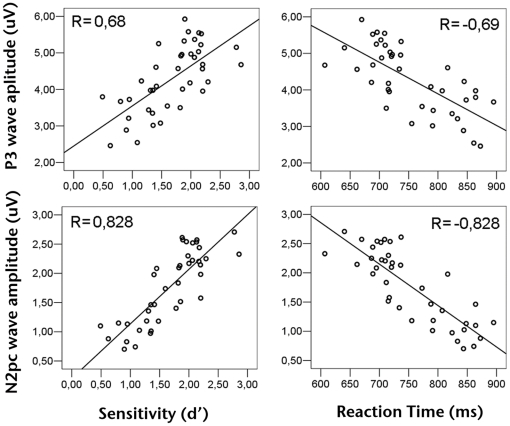
Figure 7. Relationship between ERP waves amplitude and perceptual learning.
Top left panel shows the block-level correlation between P3 amplitude and sensitivity. Top right panel shows the block-level correlation between P3 amplitude and RT. Bottom left panel shows the block-level correlation between N2pc amplitude and sensitivity. Bottom right panel shows the block-level correlation between N2pc amplitude and RT.

