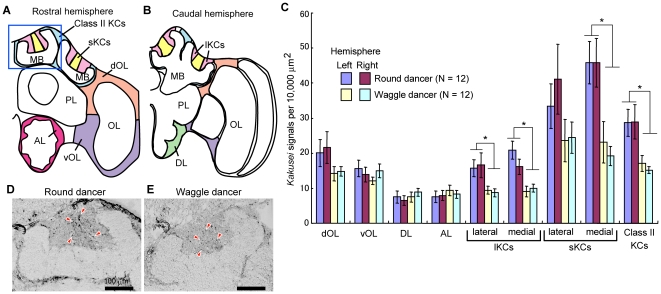
Figure 1. Round dancers have a greater number of active MB neurons than the waggle dancers.
(A and B) Schematic drawings of the rostral (A) and caudal (B) hemispheres of the worker honeybee brain. The brain regions in which signals were counted are shown in different colors. (C) Quantification data of kakusei-signal densities in various brain regions of the round and waggle dancers. Expression of kakusei was detected by in situ hybridization using coronal brain sections. A significant difference in kakusei expression between the dancers was detected in the MB neurons. There was no significant difference between the right and left hemispheres for any brain region (P>0.05). All data are represented as the mean ± standard error. Asterisks indicate P<0.05 calculated by the two-factor ANOVA. (D and E) Representative images of in situ hybridization of kakusei in the calyces of the MBs of the round and waggle dancers, respectively. The corresponding brain region is shown as a blue square in A. Some of the kakusei signals are indicated by red arrowheads. Scale bars: 100 µm. Abbreviations: AL, antennal lobe; Class II KCs, class II Kenyon cells; DL, dorsal lobe; dOL, dorsal OL; lKCs, large-type Kenyon cells MB, mushroom body; OL, optic lobe; PL, protocerebral lobe; ; sKCs, small-type Kenyon cells; vOL, ventral OL.

