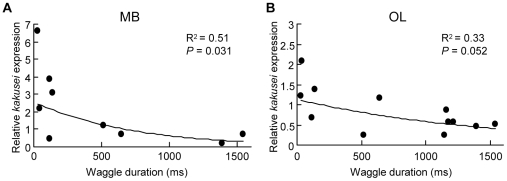
Figure 2. The amount of kakusei transcript in the brains of waggle dancers inversely correlates with the waggle-phase duration.
The relative amount of kakusei transcript was quantified by real-time RT-PCR and plotted against the waggle-phase duration. The MBs (A) and OLs (B) are indicated. The logarithmic regression lines are shown. The R2 and P values for the regression lines are shown. Note that the slope of the MBs is steeper than that of the OLs.

