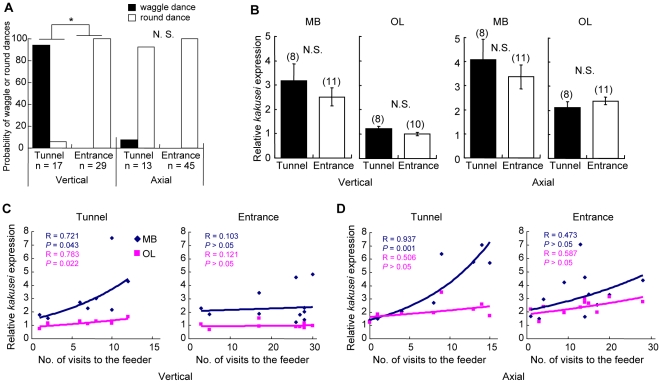
Figure 3. The amount of kakusei transcript in the brain correlates to the foraging frequency of the foragers.
(A) The probabilities of waggle or round dances. The left panel shows the data from the vertically-lined tunnel, and right panel shows the data from the axially-lined tunnel. In each tunnel experiment, the dance probabilities were compared between the tunnel and entrance groups. n indicates the number of dances analyzed. *: P<0.0001, χ2 test. N.S.: not significant. (B) The relative amount of kakusei transcript was quantified by real-time RT-PCR and compared between the tunnel and entrance groups. Left and right panels show data from the vertically- and axially-lined tunnels, respectively. Data from the MBs and OLs are shown separately. (C) and (D) The relative amount of kakusei transcript was plotted against the number of visits to the feeder during 1 hr. Data from the vertically-lined tunnels (C) and axially-lined tunnels (D) are shown. The tunnel and entrance groups were shown left and right panels, respectively. Note the robust increase in kakusei expression in the MBs. The R and P values for each regression line are shown.

