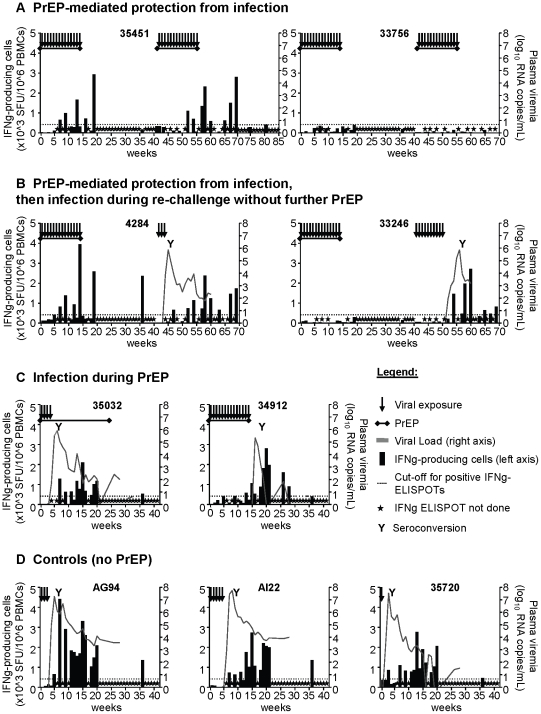
Figure 2. Chemo-vaccination effect.
SHIV-specific T cells are induced in two PrEP-protected macaques during PrEP and virus exposures. PrEP protected four macaques from infection during 14 SHIV exposures in weeks 1–14 (A and B), while two became infected despite PrEP (C); three macaques were controls (D). SHIV-specific T cells were determined by IFNγ-ELISPOT. The black bars represent the number of specific T cells as a sum of responses to 14 SHIV-derived peptide pools for antigenic simulation, measured in SFU (spot forming units, left axis). Grey lines depict plasma viremia (right axes). The graphs represent data from individual macaques, their identification codes are bolded. The dotted lines are cut-off values for positive T cell responses. Two PrEP-protected macaques (35451 (A), 4284 (B)) showed signs of chemo-vaccination. During re-challenge with 14 SHIV exposures in weeks 42–55, additional PrEP protected macaques 35451 and 33756 (A). Chemo-vaccinated macaques 4284 and 33246 were not protected from SHIV infection (B). Throughout the study, anti-SHIV antibodies were determined every 6 weeks (weeks 1–41) or 4 weeks (weeks 42–69). “Y” indicates time of seroconversion.

