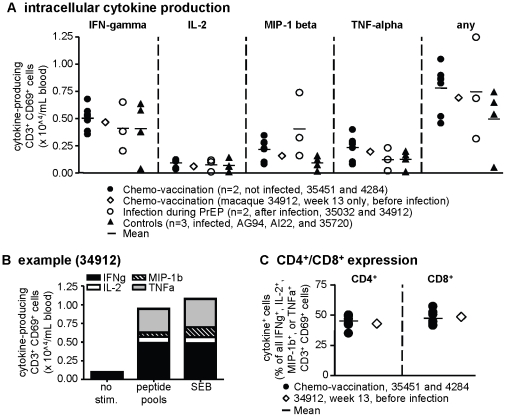
Figure 4. Cytokine production of CD4+ and CD8+ T cells induced by chemo-vaccination.
Intracellular production of IFNγ, IL-2, MIP-1β, or TNFα was measured by flow cytometry after in-vitro incubation of freeze-thawed cells with the two dominant peptide pools as determined by previous IFNγ-ELISPOT. We gated on CD3+ and CD69+ (A, B), or on CD3+, CD69+, and CD4+ or CD8+ (C), and determined the number of cells with intracellular production of any of the factors, regardless of whether they simultaneously produced the remaining 3 factors. “Any” refers to cells producing any of the indicated factors, not necessarily all simultaneously. Samples from infected controls or infected PrEP-treated macaques were from peak viremia or 6 weeks thereafter, whenever available. Such samples are not shown for CD4/CD8 analysis, because CD4+ cells significantly decline depending on the stage of SHIV infection. (B) Representative example of results obtained with cells from macaque 34912 before its infection, without stimulation (“no stim.”), with the two dominant peptide pools, or with SEB for polyclonal stimulation.

